We are carrying performace tests on one of new EOS nodes (EOS 5.3.10-1 installed) with 8 x SSDs and 100Gb card and we are persistently hitting a bottleneck for write-only workloads (~70Gb/s) which also affects reads in mixed I/O workloads.
All NIC tuning has been done and we have established that it is the kernel page cache that is somehow gets on the way. Given that, in general, the page cache improves storage node perf there must be something wrong in the way that is configured on our node.
My question to you: have you modified any page cache kernel settings on the EOS nodes that used as CTA buffer? For example, do you use write through (default I think) or write back cache?Have you changed any other parameter in /sys/block/dev/queue/ ?
I did not have to tweak anything for the current Run-3 generation of hardware, I am getting 25Gb/s Write + 25Gb/s Read which is 50Gb/s worth of IO with like really old machines by today’s standard.
Before going to the EOS layer, did you try to run series of microbenchmarks to qualify your new hardware? I usually spends quite some time with ddwriting or reading large byte streams on raw device (flushing cache between microbenchmarks) to qualify HDDs/SSDs/NVMes to understand potential bottlenecks at the disk/flash or HBA level when multiple storage subsystems are involved. Then doing the same at FS level should give you similar performance as EOS long byte streams.
Changing cache setting is not the way to reproduc production performance as caching in memory would not be enough for anything close to production: files stay on disk servers for 20-30 minutes this would not fit in any kernel cache layer.
Do you have some dd flushed to storage numbers/graphs? Like writing 1TB per MVMe in parallel to 1, 2, 3,… systems at once, then read back and so on?
Before going to the EOS layer, we did run some standard FIO straming tests on the node’s SSDs and we got the advertised performance for a single a drive and a nice linear scaling for multiple drives. It is only after we ran into the performance issues with EOS that we re-ran FIO but now using buffered (instead of direct) IO and we confirmed that the bootleneck is indeed related with the kernel page cache.
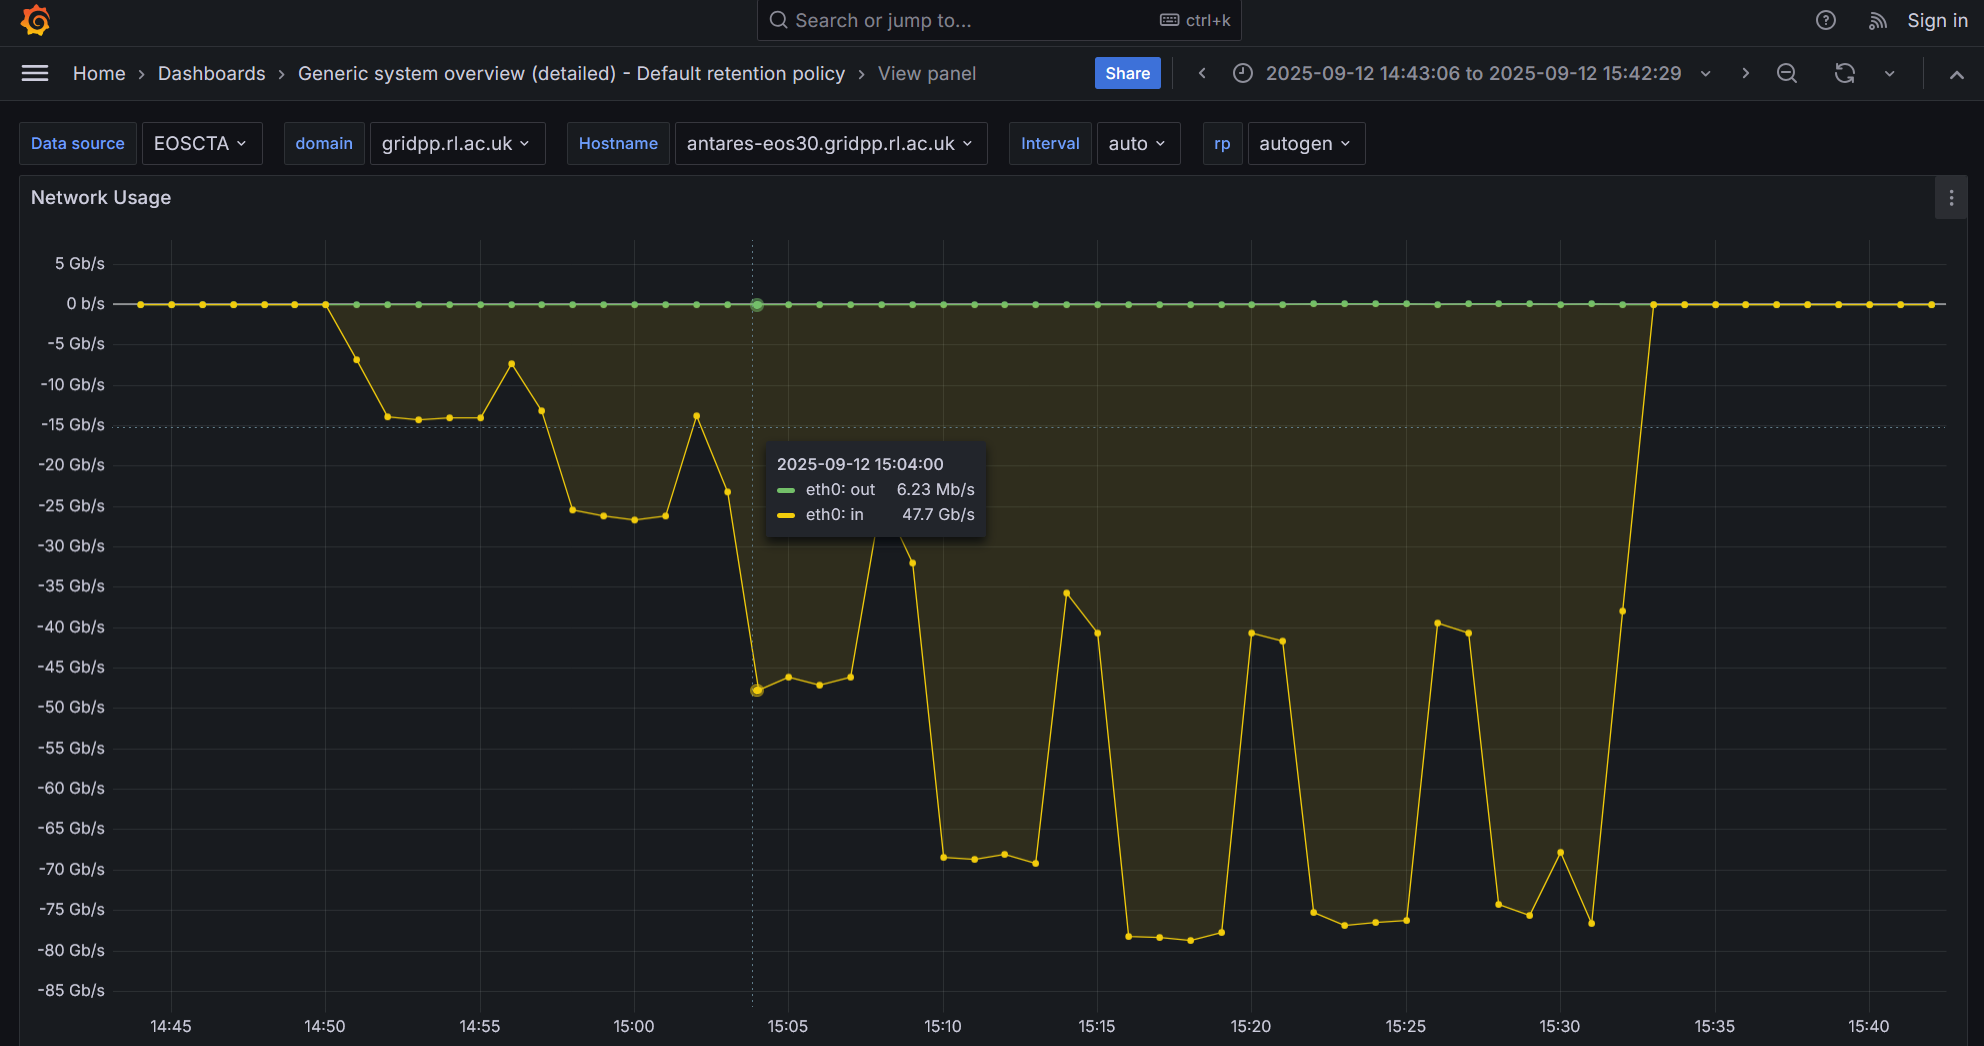
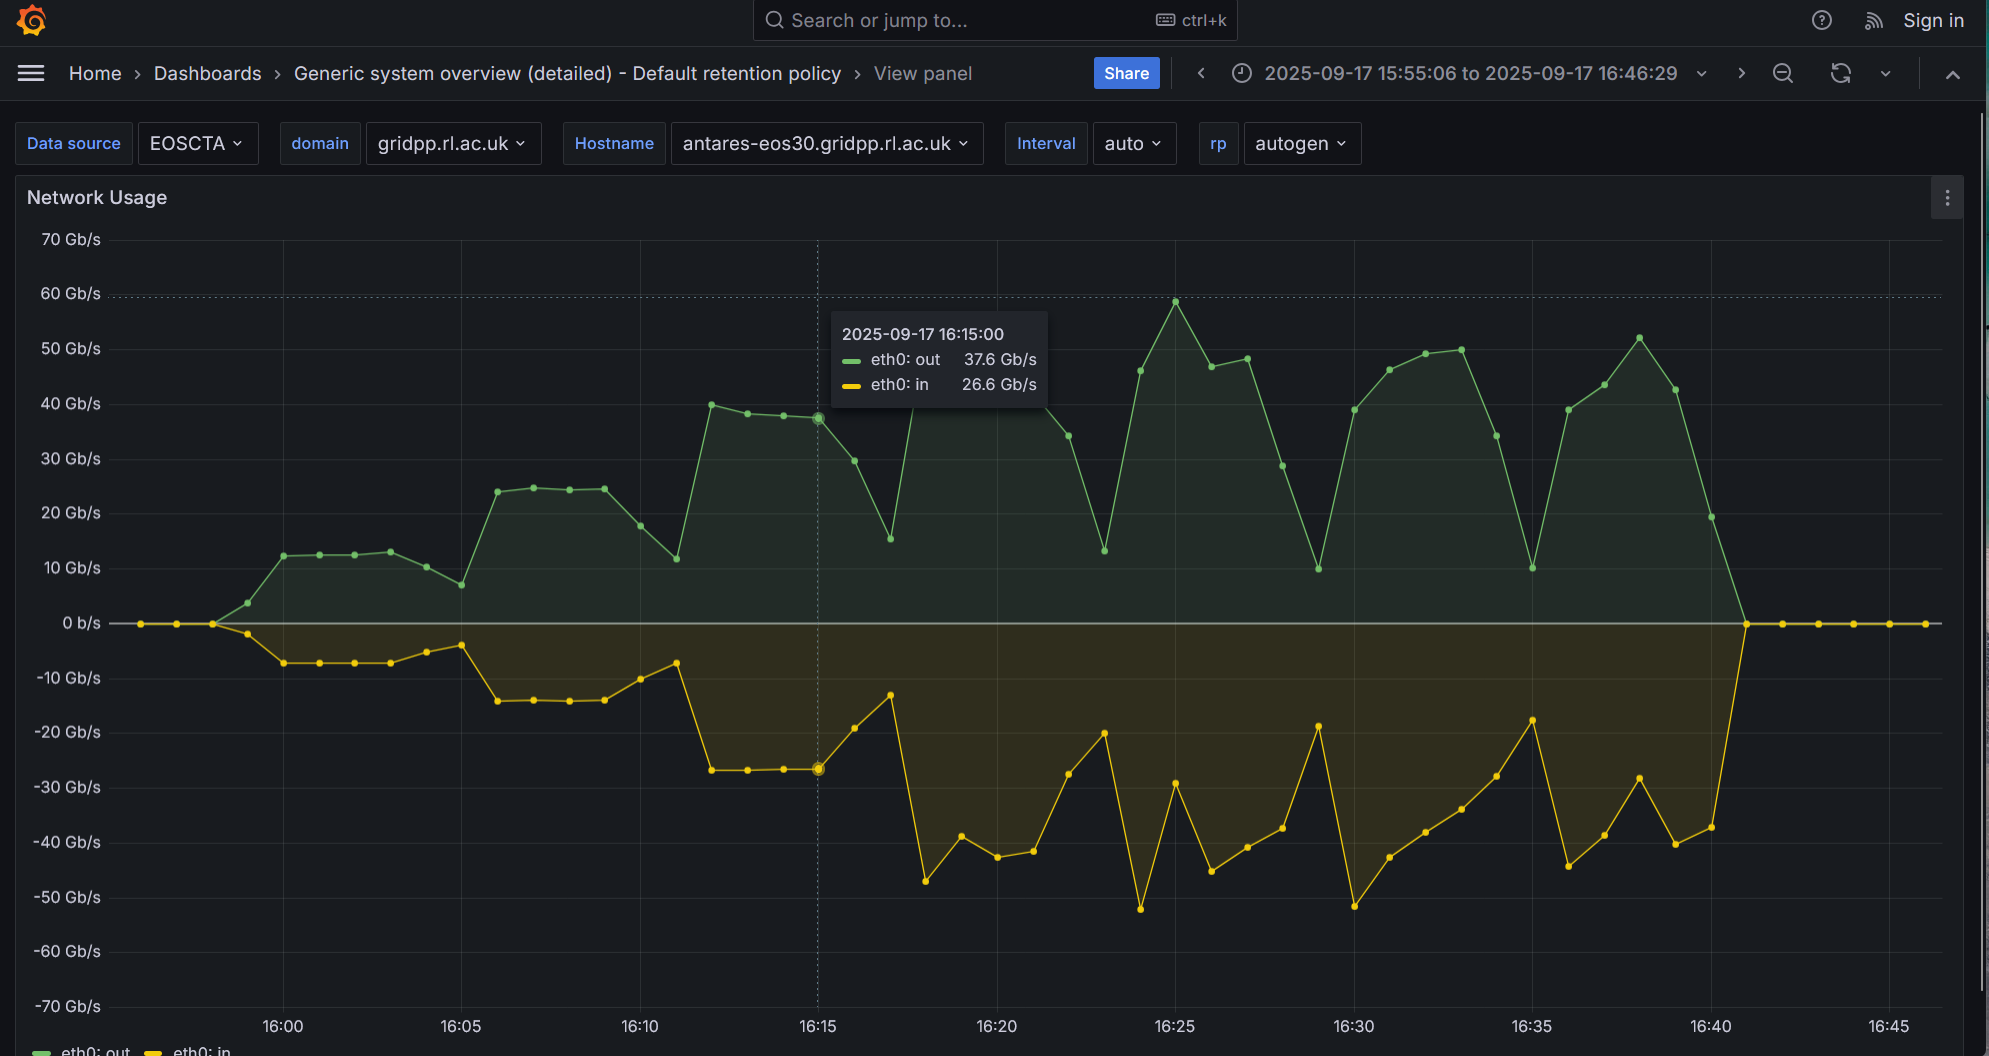
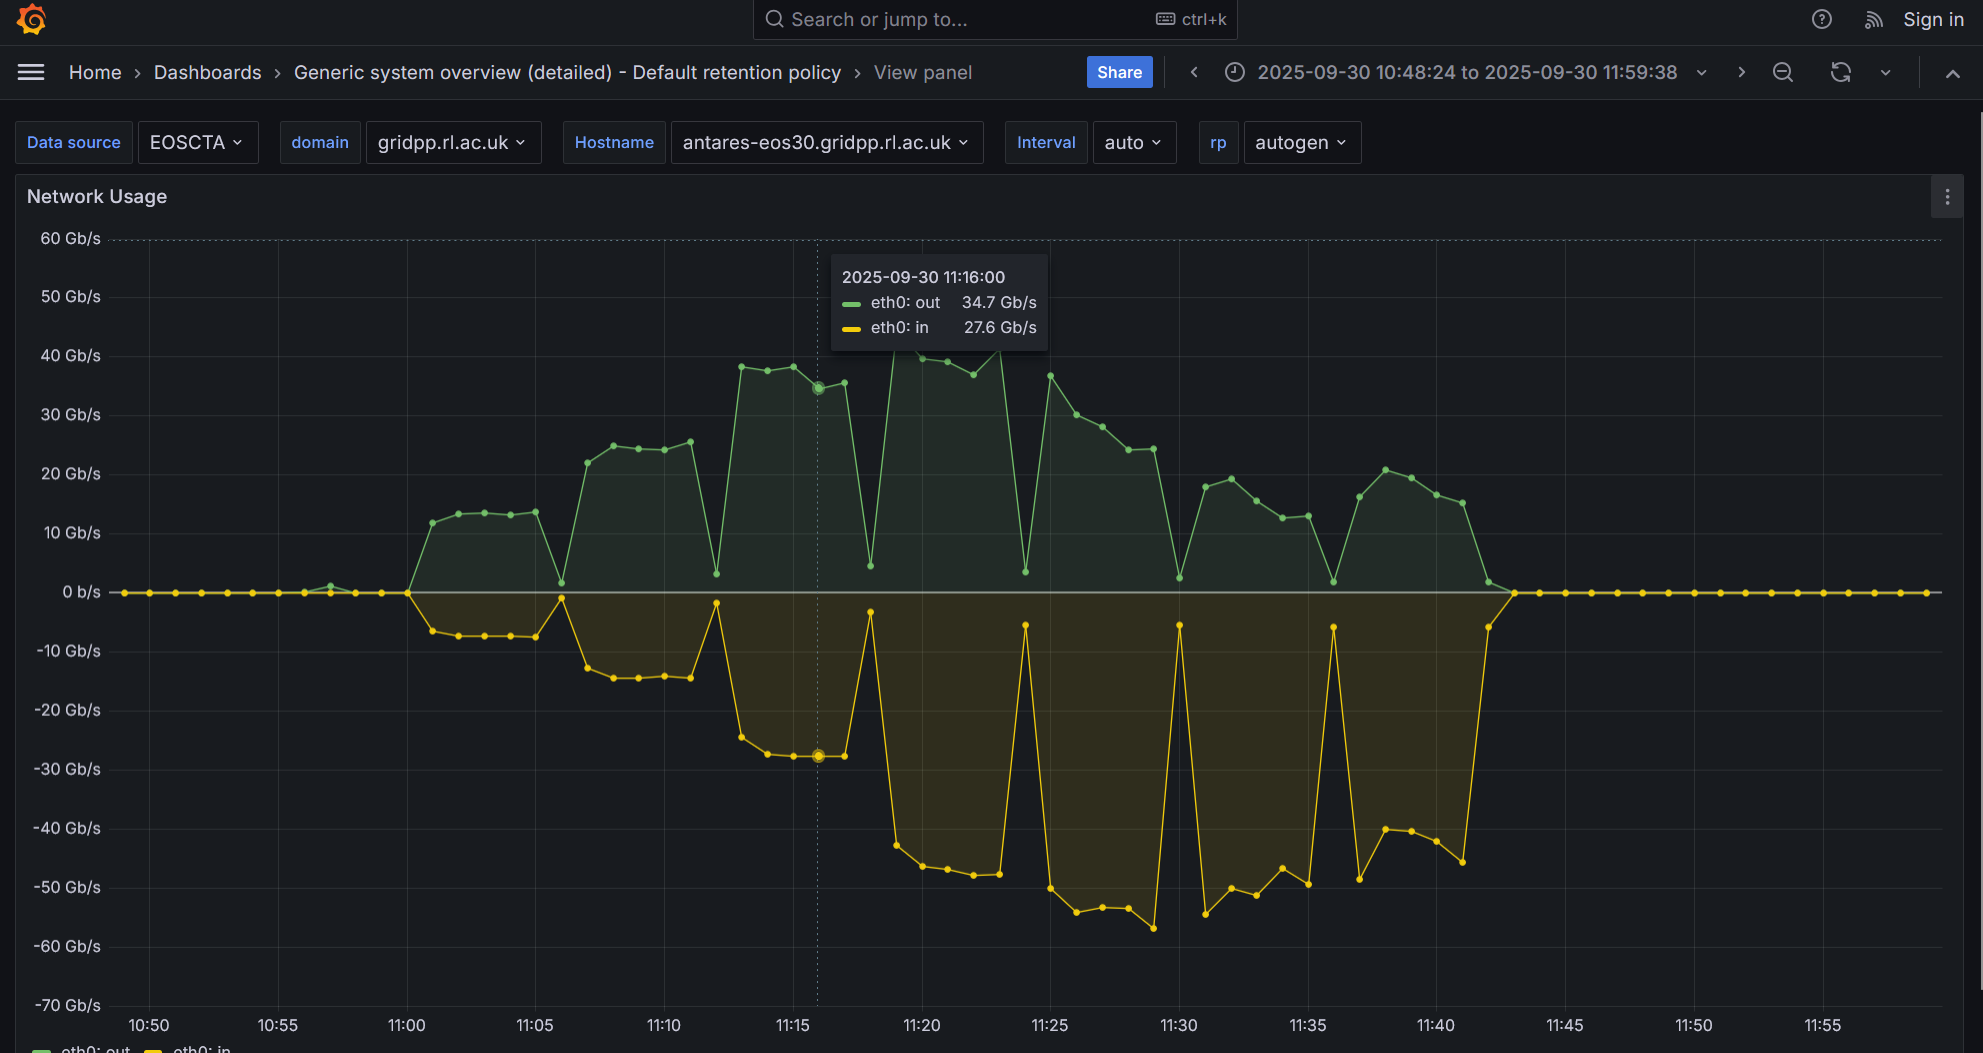
For the EOS testing we run a series of increasing parallel XRootD transfers - 2, 4, 8, 16, 32, 64 and 128 - from two different client machines that are on the same network and have also 100Gb NICs.
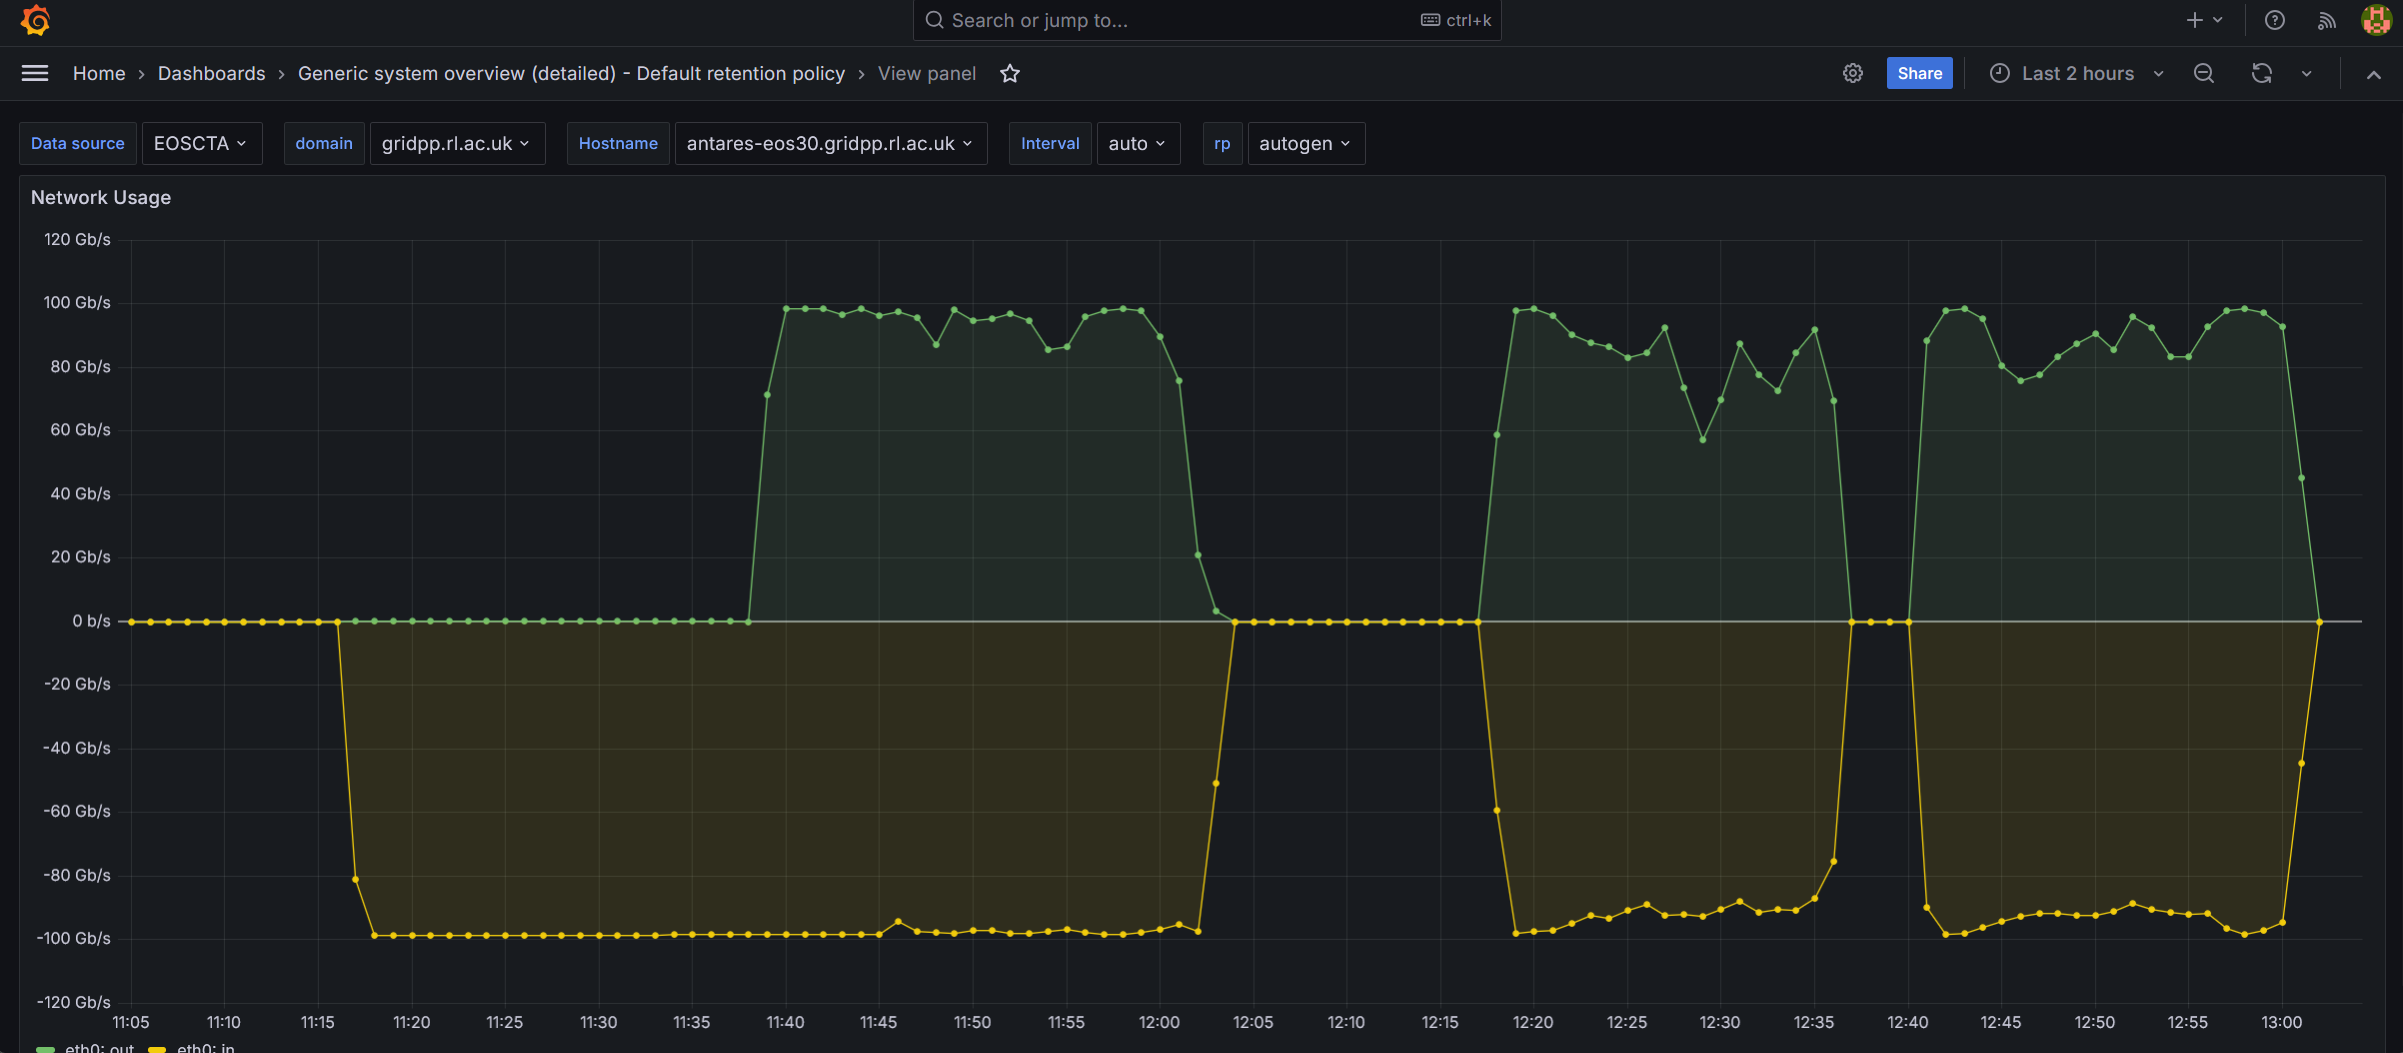
Pasting some Grafana screenshots from representative tests
Before getting into local microbenchmarks, let me ping EOS devops team as they have some 100Gb machines on their side (contrary to CTA Service) and may have some valuable hints for EOS tweaking.
You may try direct I/O with EOS if you wish.
One can activate direct I/O by adding the following extended attribute on the destination directory:
eos attr set sys.forced.iotype:w=direct /eos/path/to/dest/dir
If you want it at the space level (better if you want to apply it for every transfer), you can set it like eos space config <spacename> space.policy.iotype=w=direct (4.5. Interfaces — EOS DIOPSIDE documentation).
Please tell us if that improves the performance!
Otherwise, could we organize a zoom call for live-debugging and testing!
You can try direct IO in EOS to get better throughput. The buffer cache becomes a bottleneck around 8-10 GB/s once it is full. I have seen the same in benchmarking on 100 GB hardware.
Here is the documentation:
`` # configure default FST iotype eos space config default space.policy.iotype:w=direct
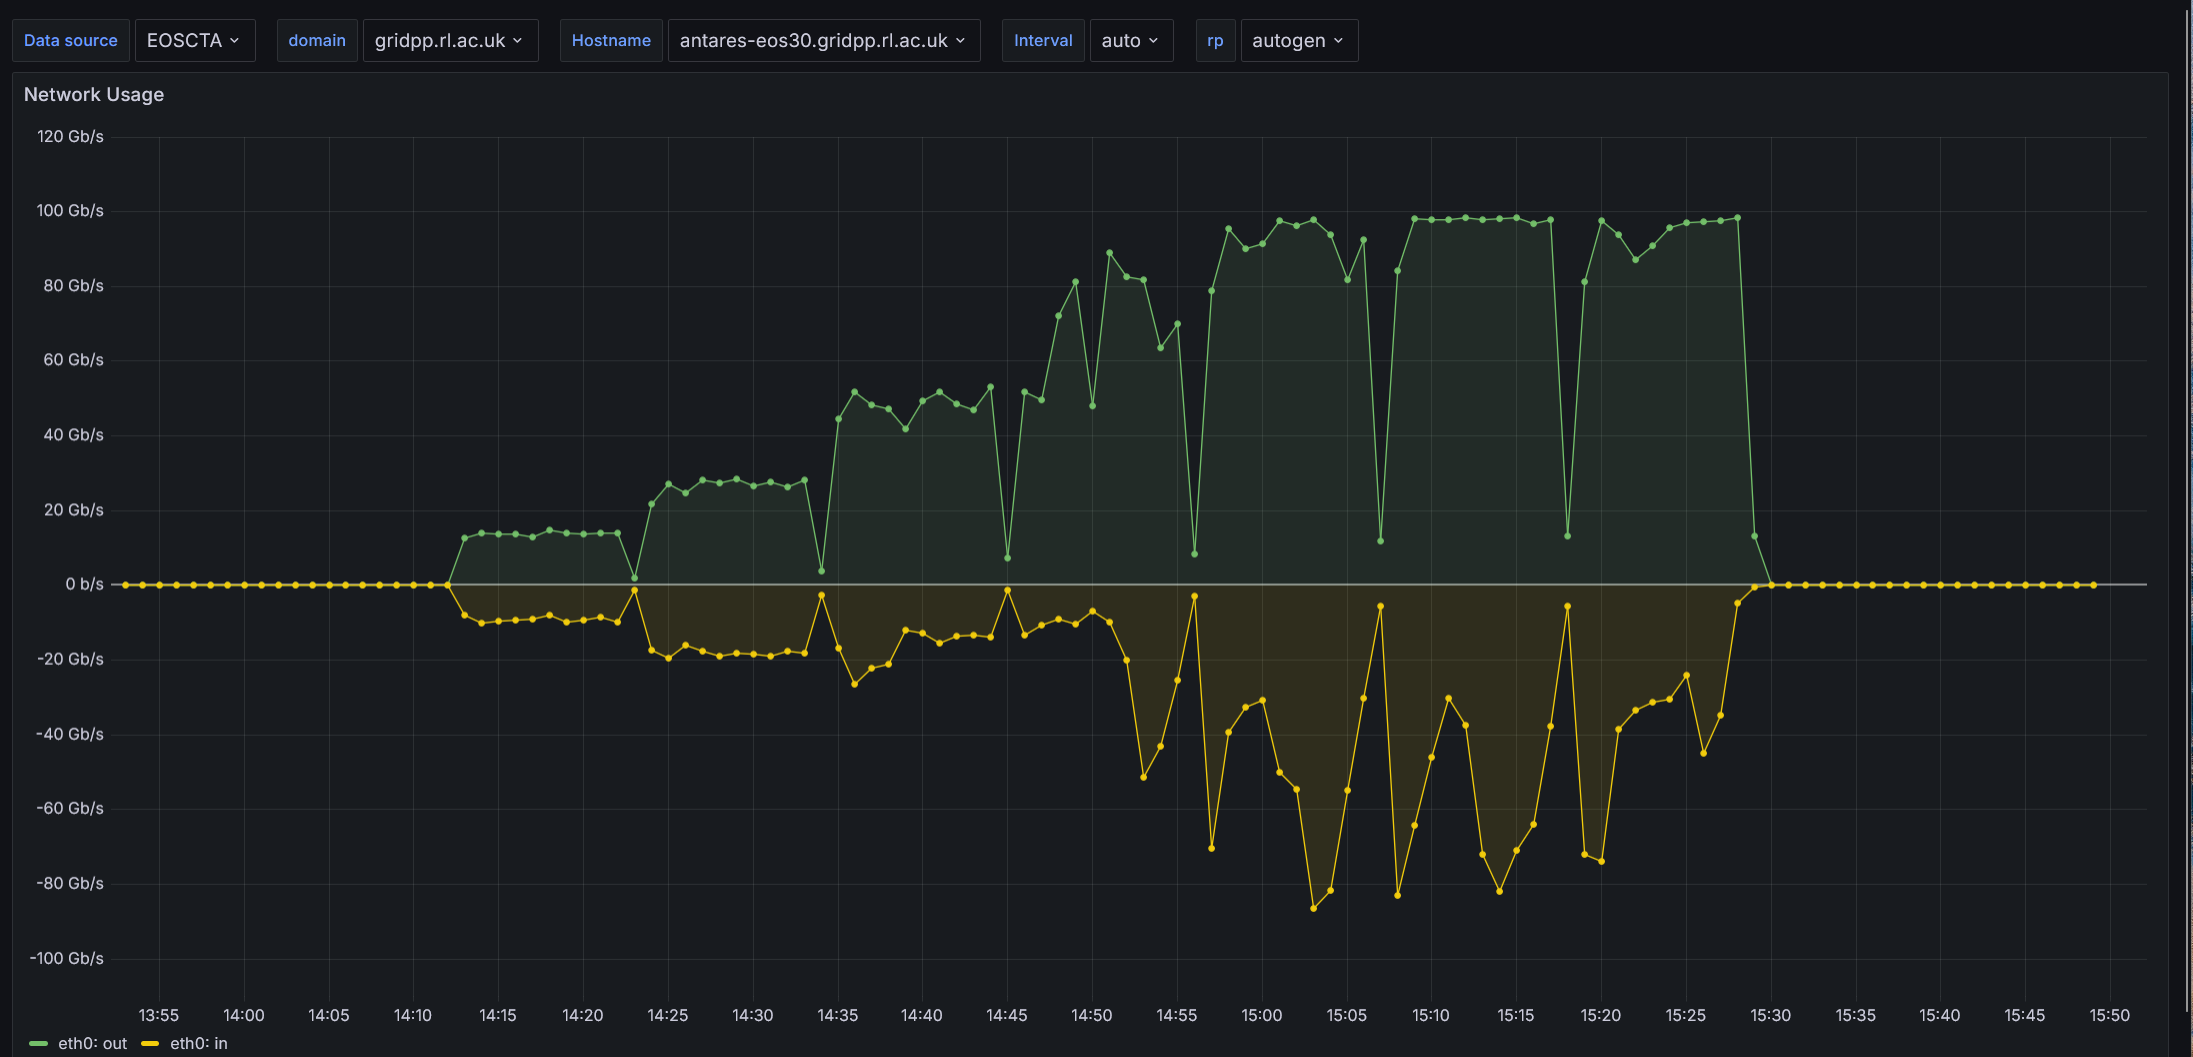
The performance certainly look better(!) but I am a bit troubled with the large network i/o fluctuations observed with increased number of parallel transfers. Is this something to be expected?
Can it be that the following kernel settings are incompatible with the direct I/O EOS space policy
As you are using direct I/O there is no page cache involved anymore. So I guess those parameters do not need to be tweaked → their tweaking should not have any effect.
How parallel are these transfers? Do you transfer multiple batches, one after the other?
What can be done also is to try iperf3 tests between your clients and your server. That would allow to remove EOS from the loop and really test the network between your clients and your server.
Thanks for the confirmation about the parameters Cedric.
We run the following loop (on two different client hosts)
for i in 1 2 4 8 16 32 64; do echo “Starting $i transfers”; timeout 600 ./run_parallel_writes.sh $i 100; sleep 60; done
which initiates an increasing number 1,2,4…parrallel batches of XRootD transfers and each batch consists of 100 serial transfers.
We have already run iperf3 tests between clinets and the server, and we established that 8 x iperf3 transfers from one of the new EOS nodes can saturate the100G NIC card of another. So, we are happy with the NIC card. We are also happy with the direct FIO tests on the SSDs as we are obtaining the adverised performance.
I think we can organize a call so that we try different things live.
What do you think?
This week I’m available only tomorrow wednesday the 8th but next week I’m available the whole week. Don’t hesitate to reach me via email cedric.caffy@cern.ch if you want to organize a zoom chat.
Sorry for the delay. When first I tried to reproduce the performance (64 parallel writes) that we saw during our zoom chat - having set direct I/O space policy for writes and assigned 8 schedulling groups to each EOS filesystem - the network inbound rate was again fluctuating and eos fs ls –io showed that some SSDs were more loaded than others.
I rebooted, reinstalled the node and tried again and now we gor the write perf we were expecting
not sure why we didnt get in the first attempt but lets hope it stays this way….!
I am going to try running now 32 reads/32 writes and play with space.policy.iopriority as you showed us. Just to confirm: for the space.policy.iopriority to work we need to have the bfq scheduler configured on SSDs, right? We currently have none which may explain we the change didnt work during the chat.
By the way, I read that bfq is good for HDD and slow SSDs and kyber is recommended for fast SSDs. Is the kyber scheduler supported by EOS?
Thanks for your reply. I think you should probably not use the I/O priorities for your use-case. CTA does not use them and I guess direct I/O is good enough.
We report 11 observations and make 5 guidelines that indicate that (i) Kyber can deliver up to
 26.3% lower read latency than the None scheduler with interfering write workloads; (ii) with a file
system, Kyber can be configured to deliver up to 35.9% lower read latency at the cost of 34.5%–
50.3% lower write throughput, allowing users to make a trade-off between read latency and write
throughput; and (iii) Kyber leads to performance losses when Kyber is used with multiple
throughput-bound workloads and the SSDs is not the bottleneck.
Let’s try to keep the configuration simple, stupid.
Can you try real workflows with this machine? I do not know if you have a preproduction CTA instance, but it might be worth looking at how this machine behaves with loads from tape drives and read from users.
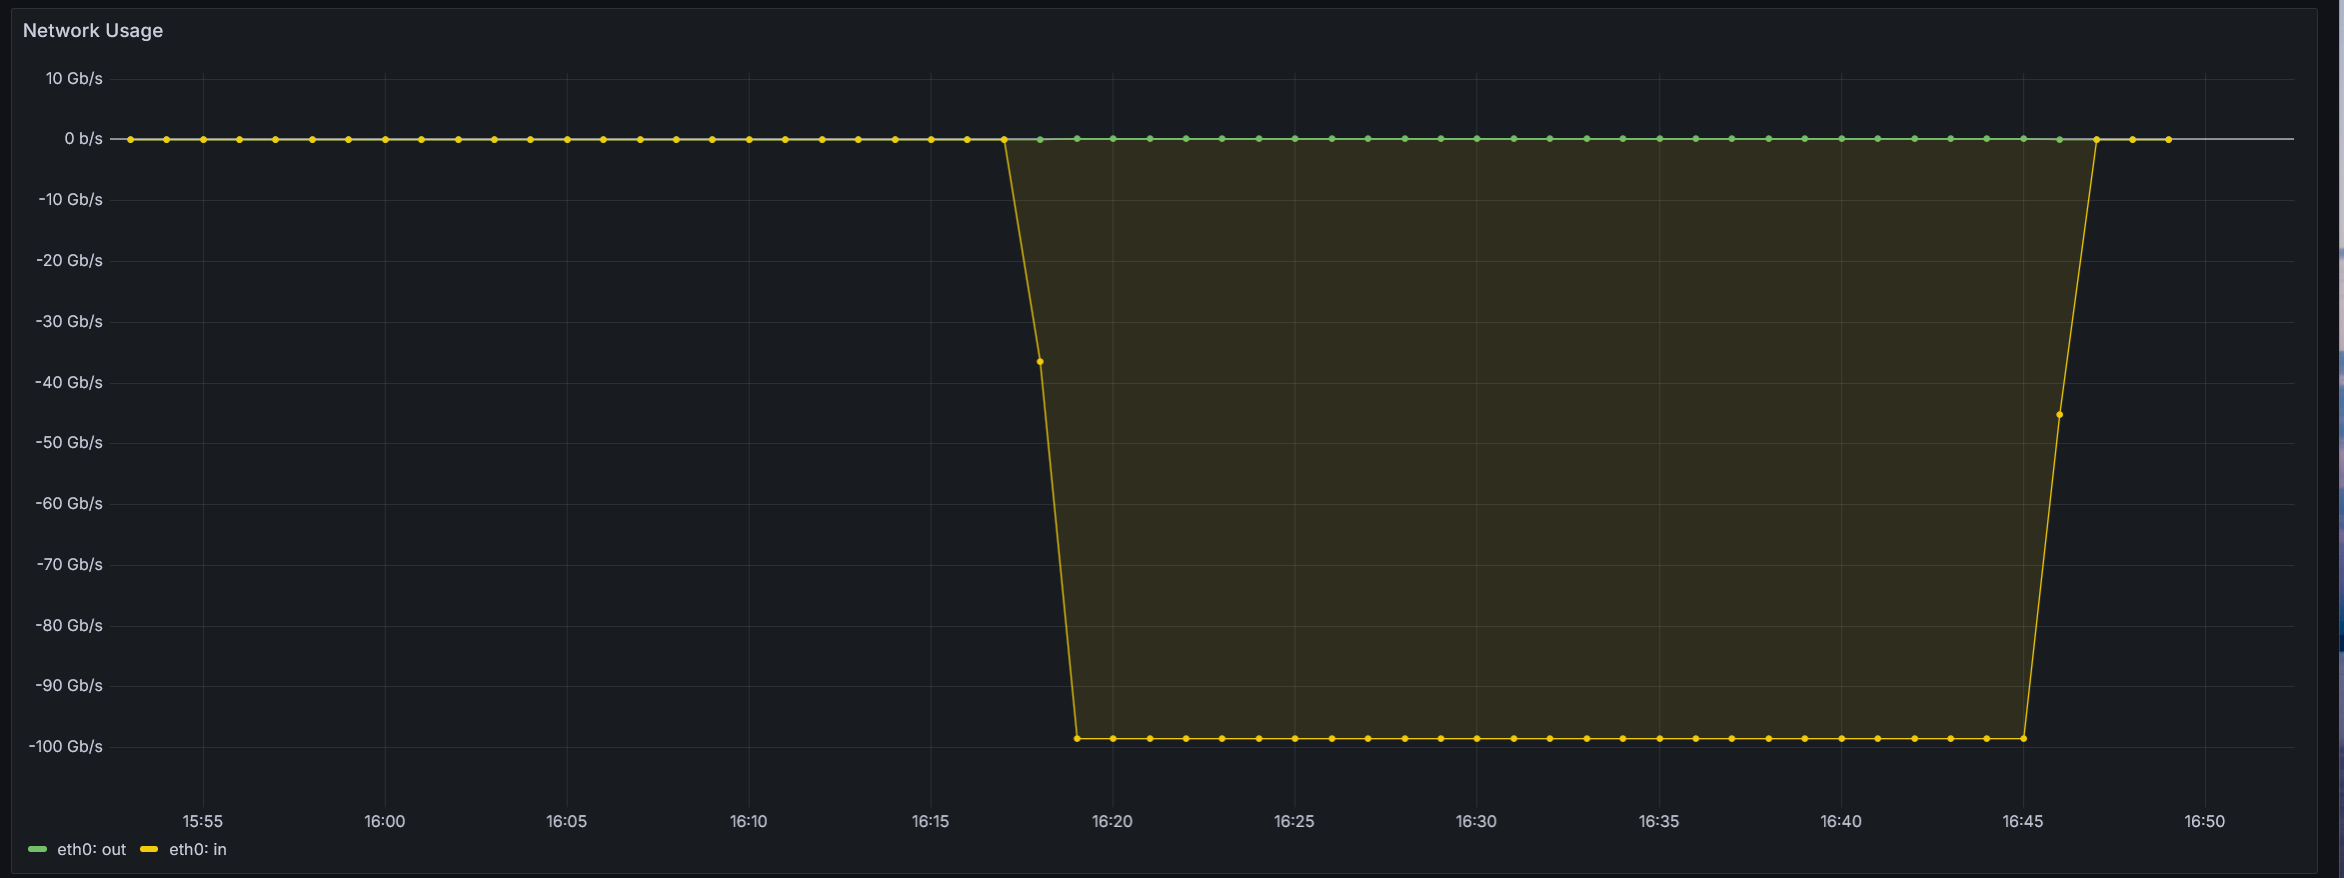
Thanks for these comments. We have nodes of this generatoin in production - although with non direct I/O and with the single scheduling group - and the real loads coming from tape servers are never high enough to get more than 10Gb/s either way.
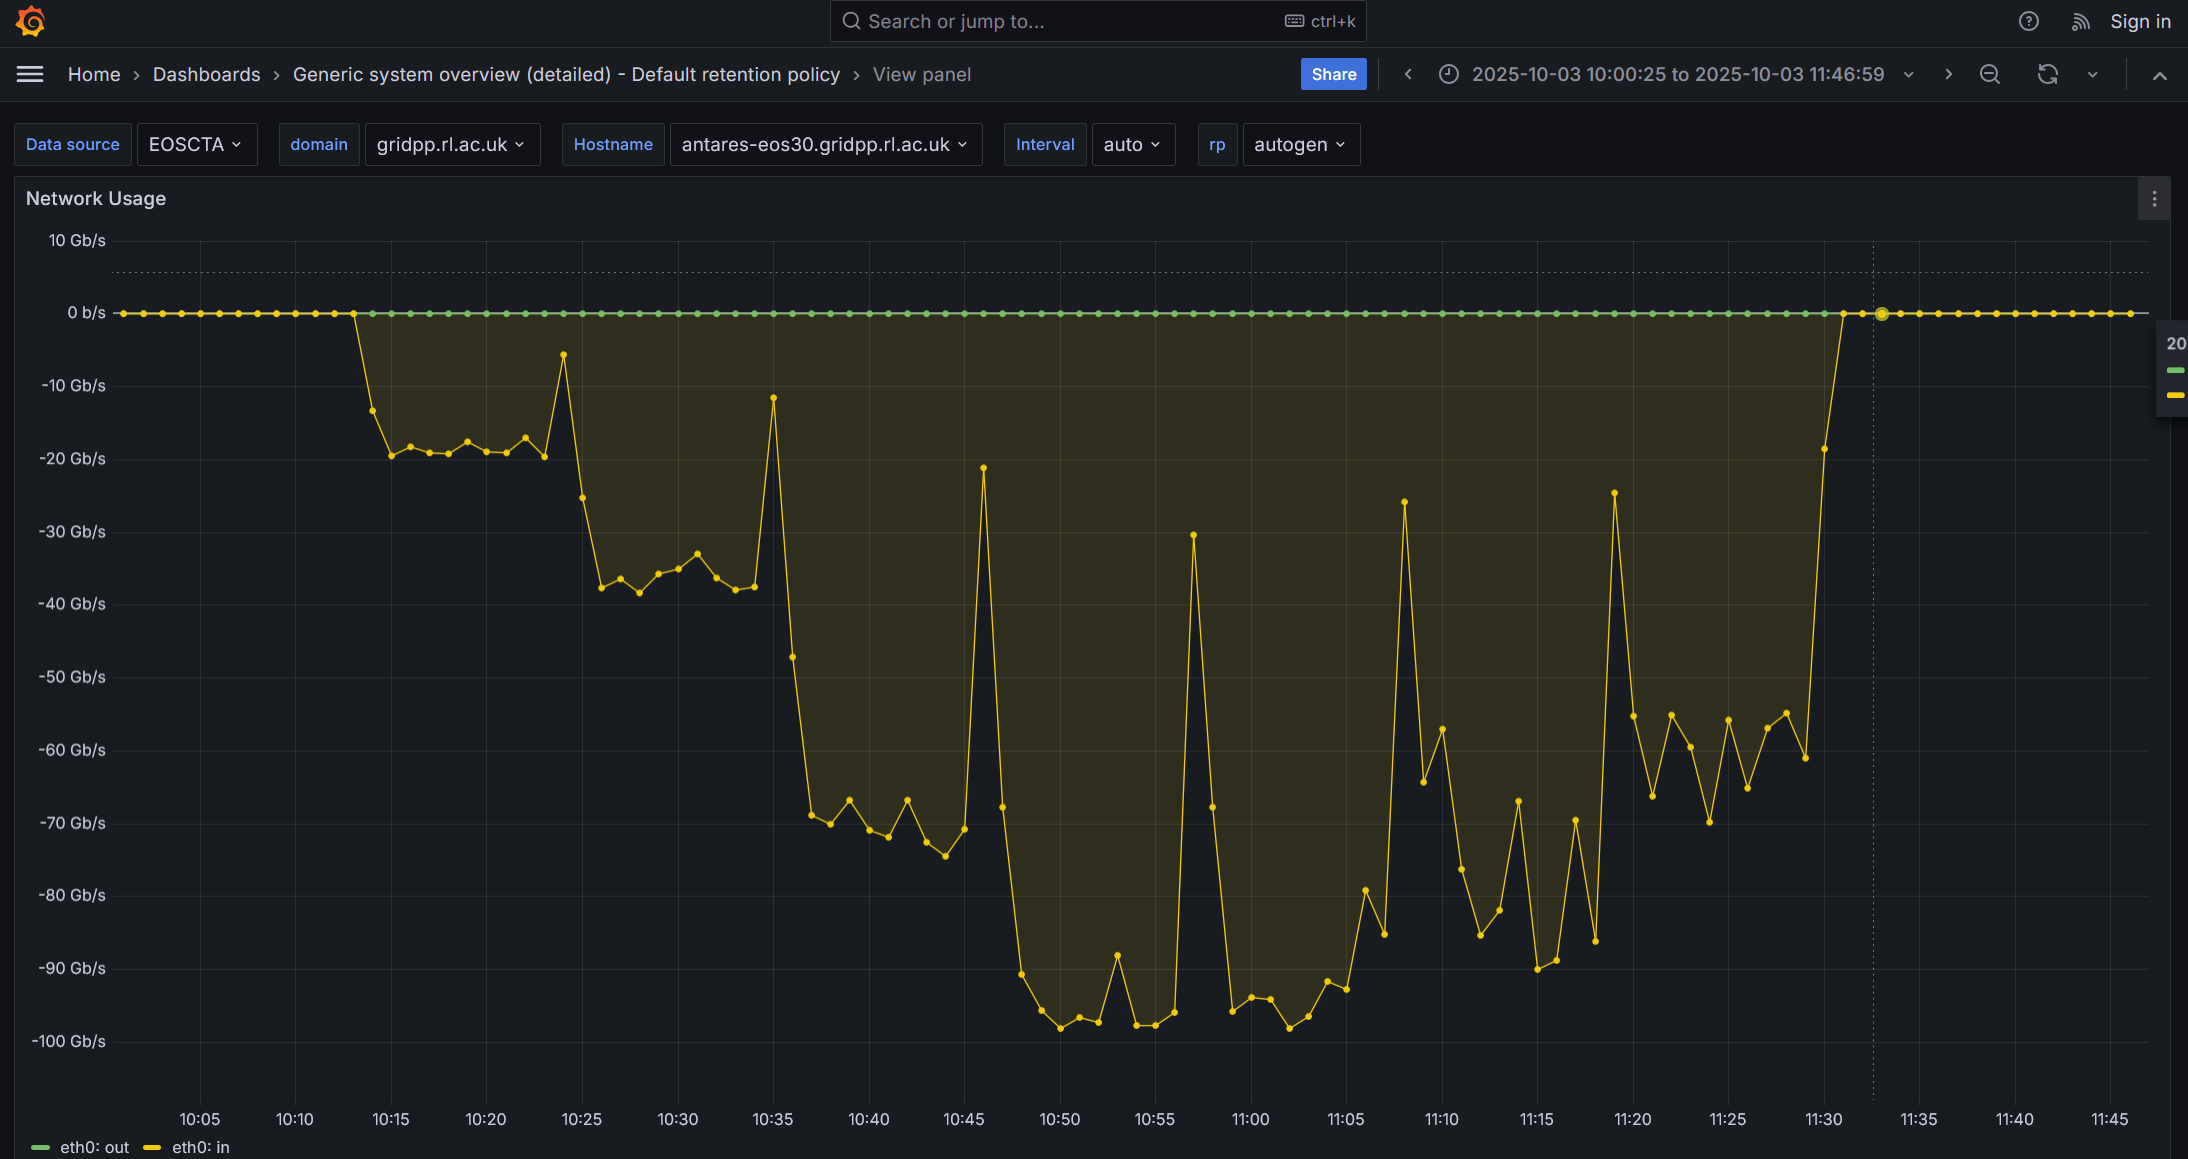
Please have a look at the following network I/O screenshot from the most recent test on the node that is deployed on our preprod instance
The test starts with 64 parallel writes and runs for about 15 mins. Performance good
Then, only 32 parrallel writes are runnig for another 5 mins. Performance remains good
After 5 mins, and while 32 parallel writes are running, I initiate 32 parallel reads. The read prod looks initially good but then it is flaky
Then I stop all transfers for about 10 mins and I restart 32 writes and 32 reads. The read perf is even more flaky and wrtie perf also shoes signs of degradation
I stop all treansfers for a few mins and restart 32 writes and 32 reads. Write perf is not so bad the read perf conitnues flaky
I did notice a disk “hot spotting” during the last two sets of tests: the SSD with the lowest occupancy (but not more than 2% less compared to the other SSDs) attracted at some an abnormally higher number of reads and writes, 4-5 times higher than other SSDs. For example
Towards the end of the test, I noticed that the SSD “hot spotting” dissapeared for a short time (I/O was more balanaced across the SSDs) which correlated immediatelly with the maxing-out of the iftop rates. As this lasted only a few secs you cant see it in the above screenshot.
As per your suggestions, I thought the assignment of a seperate scheduling group to each SSD/Fileystem ensures a balanced distribution of transfers. Is this a bug in the EOS scheduler or what?
Yes, that’s why I wanted to talk to my colleague, it is exactly related to that.
You may try them → roundrobin, random… and see if you see an improvement. But we are not sure it will actually work because you do not have many SSDs as well in the thing.